

The continues research program dedicated to kiwifruit decline, financed by Elle Esse AOP under the Operational Programme of the Common Market Organisation for fruit and vegetables. After the launch in March, the project comes to life with daily analyses on six plots in the province of Latina.
Six plots under observation, to understand what happens above and below the tarps
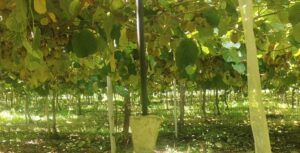
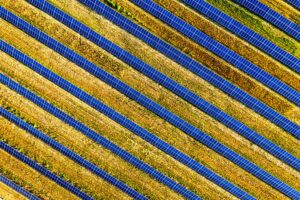
The activities of the 2025 season are concentrated on a sample of approximately 20 hectares, distributed between three agricultural companies in the province of LatinaEach company provides two plots of land cultivated with yellow and green kiwifruit, one of which is covered with anti-hail tarps and one uncovered. The objective is compare the vegetative evolution of plants under different growing conditions, using high-time-frequency satellite observation instruments.
The monitoring period runs from March 1st to November 30th, thus covering the entire vegetative cycle, from post-winter recovery to harvest and beyond.
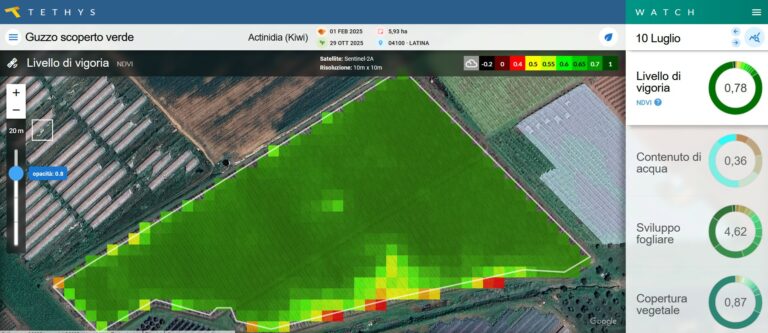
Vigor maps and timely alerts: Watch as a field reading tool
A key part of the project involves the use of WATCH, the service that allows you to detect the vegetative state of crops through biophysical and vegetative indicesEach plot is analysed regularly, and if signs of localised stress emerge, the producer receives a timely reporting, with the invitation to verify the nature of the problem directly in the field.
So far, no critical situations have been detected, but the analyses have highlighted variations in vigor even within the same plot, often not perceptible to the naked eye. In some cases, comparison between plots shows different development rates, which the research team is investigating together with farmers to understand the causes: from irrigation practices to soil management, to the different response of plants to microclimatic conditions.
Water under control: daily water balance to avoid excesses
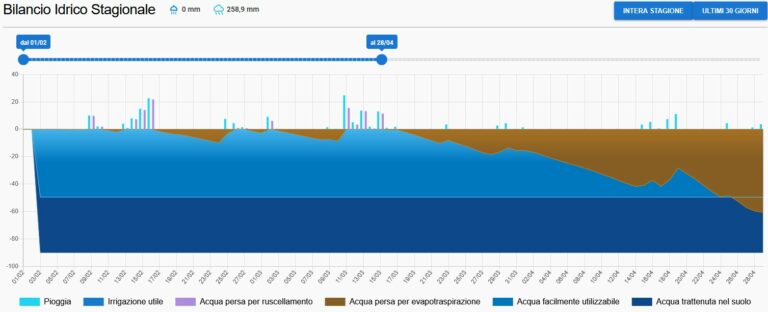
In parallel with vegetative monitoring, each plot is analysed with the module WATER, which calculates the actual evapotranspiration daily and constructs the water balance. This allows us to verify whether the irrigation volumes administered actually correspond to the plants' needs.
Data collected in February and March show that rainfall initially covered water needs, but irrigation became necessary as early as April. Attention now shifts to August and September, when—closer to harvest—farmers concentrate their greatest irrigation needs. This will be the key period for check whether any excess irrigation can be related to episodes of kiwifruit mortality.
Towards a more precise agronomic knowledge
The data collected so far is contributing not only to real-time monitoring but also to the refinement of kiwi cultivation parameters within the TETHYS system. Specifically, the timing of the phenological phases is being defined in greater detail based on soil and climate conditions and the cultivation techniques adopted.
This information will constitute a solid foundation for building increasingly accurate decision support tools for kiwifruit management, and they may also be useful for targeted agronomic interventions in the fight against die-off.
The project continues, and with it the quantity and quality of available information is also growingStep by step, kiwifruit is becoming an increasingly legible, predictable, and—hopefully—hardy crop.