With the adoption of the TETHYS system, the Spring Water Reclamation Consortium of Venice has inaugurated a new approach to water resources management: more efficient, digital, based on satellite data.
A vast territory, a growing challenge
The Spring Water Reclamation Consortium manages an extensive reclamation network for irrigation and environmental purposes that interests approximately 68,000 hectares of cultivated surface located in a highly urbanized and well-infrastructured area of just over 100,000 hectares in the central part of the Veneto region between Venice, Padua, and Treviso.
It is a large, diversified and fragmented territory, with variable water needs due to the presence of different crops and characterized by a uneven and usually scarce water availability during the summer months of greater use. In this context, the further risk of increasingly intense weather events determined by the ongoing climate transition and the need to respond to the technical needs arising from a increasingly complex regulatory framework.
There agricultural water management it is therefore a strategic priority, not only to ensure productivity, but also to meet the criteria of environmental sustainability, equity And traceability.
In this scenario, the Consortium has decided to innovate its approach, adopting a satellite monitoring system for irrigation practices based on the technology developed by TETHYS.
The TETHYS model: monitoring from space
The work was distinguished by a key element, namely the'satellite image analysis made available by Sentinel 2 ESA and Landsat 8 and 9 NASA and theapplication of advanced environmental models, in particular the SEBAL model (Surface Energy Balance Algorithm for Land), which allows you to accurately estimate theeffective evapotranspiration of cultivated surfaces.
In practice, TETHYS measures how much water crops actually need, on a daily basis, through the water balance calculation, using data collected by satellite and combining them with meteorological and soil type data.
This choice allows to completely eliminate the operational constraints typical of technologies based on field devices. At the same time, the system allows a homogeneous and continuous monitoring throughout the investigated territory.
Irrigation needs and actually irrigated areas, two key tools
The project was structured around two fundamental axes, which transformed territorial observation into an operational information system:
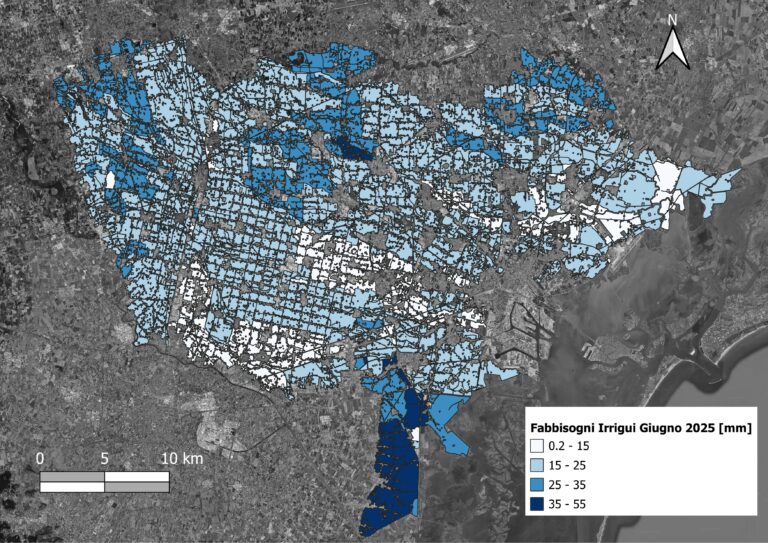
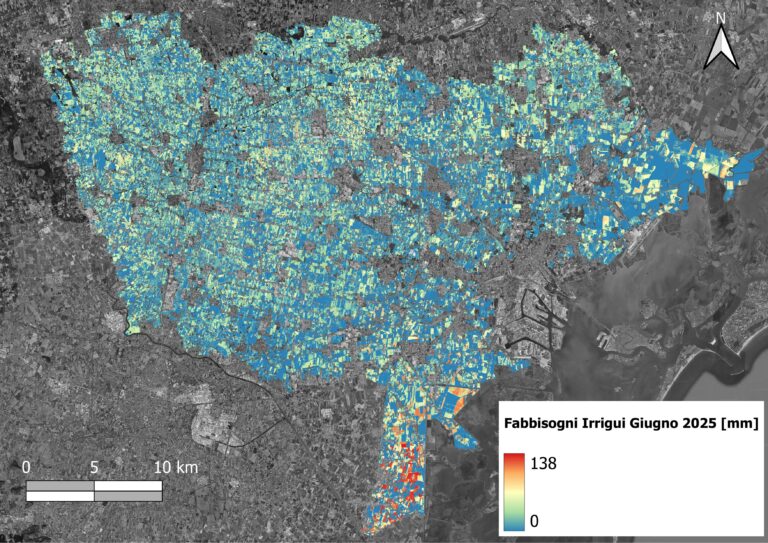
1. Map of cumulative irrigation needs
For each point in the territory (10x10 meter pixels), the cumulative water requirement was calculated starting from the beginning of the agricultural season (May 1st). The result was a detailed map, updated throughout the season, which allows for precise visualization. where, how much and when crops need waterAlongside the map, summary tables helped the Consortium's technicians identify the areas with the highest water needs and better regulate the diversions based on actual availability.
2. Map of irrigated areas
Thanks to the analysis of the water balance of the crops, the system has also identified which portions of the territory have actually been irrigatedThe simple, high-resolution binary classification used ("irrigated"/"non-irrigated") allowed for extremely detailed reading of the information. Again, the information was aggregated by area of interest.
The year 2025 was dedicated to implementing the system and verifying its coverage and qualitative validity of the data.
In-season monitoring and post-season planning: why this data makes a difference
The maps and data provided by the model were not kept locked in a report. On the contrary, they were designed to be integrated into the Consortium's daily processes, with three main purposes:
Optimizing water resource management
Knowing the actual needs of crops in real time allows you to calibrate water distribution more rationally, avoiding excesses, shortages, or waste. It's a concrete step toward more sustainable and responsive irrigation.
Improving relationships with irrigated farmers
By overlaying the maps provided to the consortium land registry, it is possible associate each irrigated surface to the corresponding userIn this way, both crop needs and resource uses are highlighted, allowing for more effective interaction between the Consortium and farmers.
Facilitating Institutional Reporting (SIGRIAN)
At the end of the irrigation season, the data produced by the model provide the basis for compiling the SIGRIAN, the national irrigation volume reporting system, according to the guidelines established by the Ministry of Agricultural, Food and Forestry Policies (MIPAAF). This often burdensome task for consortia is significantly simplified and made more precise here.
Correspondence with ground data
To better calibrate the calculation models, during the irrigation season and at its end, on a portion of the consortium territory of approximately 600 hectares equipped with technical irrigation and meters, a comparison of the volumes of water estimated by the model with those actually used from the consortium agricultural companies.
The comparison between the calculated and measured data was carried out for the'entire irrigation season (from May to September) and provided excellent results, which confirmed the quality of the estimation models used, with one very limited overall deviation (in the order of 5%) between the two variables. A normalized root mean square error (NRMSE) of 4.5% indicates a high ability of the model to reproduce overall irrigation volumes and a root mean square percentage error (RMSE) of 17.3% highlights moderate deviations in the different districts analyzed.
Future prospects
The project carried out with the Consorzio Acque Risorgive has allowed us to introduce an important innovation in irrigation management and has been arelevant training experience which allowed for seize the potential benefits of this technology, the precautions to be taken to simplify the interpretation of the data flow and to use it throughout the season and finally to highlight the types of areas to be monitored to make the data elaborated by the model more robust, starting from satellite information combined with actual climate evolution.
To make it easier to use the data during the irrigation season, it is believed that next year a index of the degree of satisfaction of water needs (WSI – Water Satisfaction Index) to be displayed in the consortium management control system used by field staff.
As you can see, it is not just about technology, but about a more advanced governance model, where access to objective and updated data allows faster, fairer and more documentable decisions. It is therefore one flexible tool And suitable for the consortium reality which manages large irrigated areas.
In a context where water availability will be increasingly limited and controlled, Knowing where, when and how much to irrigate is not only useful: it is essential.