L'NDVI it is a fundamental index in precision agriculture and is useful for evaluating and monitoring it state of health of plants in a specific plot of land.
It is a very intuitive and easy to interpret index. It is calculated as the ratio between the difference and the sum of the radiation reflected in the near infrared and red:
(NIR – RED) / (NIR + RED)
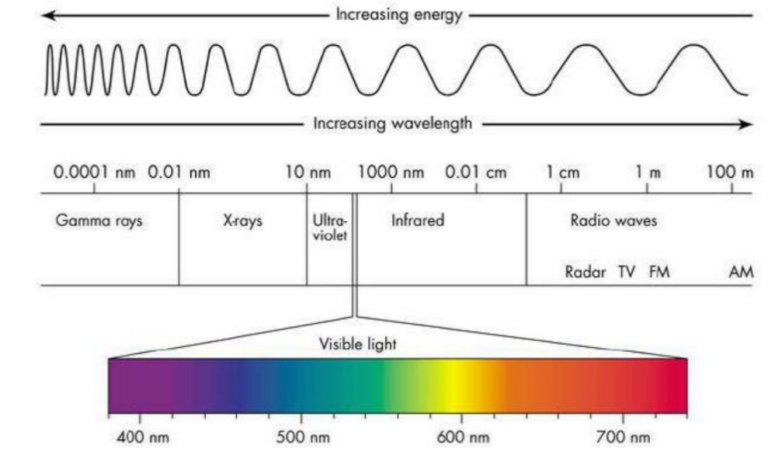
But how do you obtain the data needed to make this calculation?
It is possible to derive these values starting from satellites in orbit which, thanks to latest generation optical sensors, are able to return images containing precious data on the reflectances of infrared (IR) and red (RED) radiation coming from the earth's surface.
The sensors, in fact, measure the amount of sunlight reflected by the vegetation which, due to the chlorophyll content of the leaves and other "green parts" of the plant, interacts in a very interesting and useful way with the frequencies of near infrared (Near InfraRed or NIR: 214-400 ThZ).
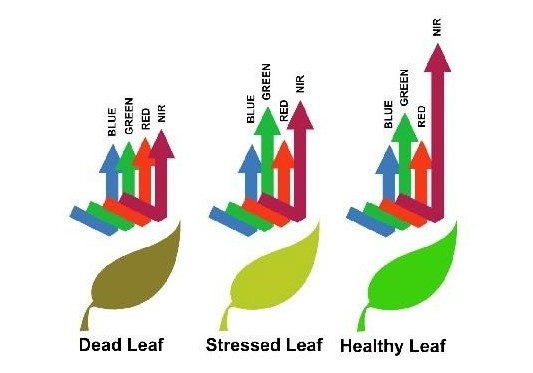
These detect the degree of development and health of the plant: the reflected near-infrared radiations increase when the vigor of the plant improves (on the right in the figure below), while if the crop has problems, the NIR radiations that are reflected by the leaves are reduce (on the right in the figure).
To be precise, the NDVI varies between -1 and 1 e it grows as the health and luxuriance of the plant increases, with the negative values typical of non-agricultural areas (water and urbanized areas).
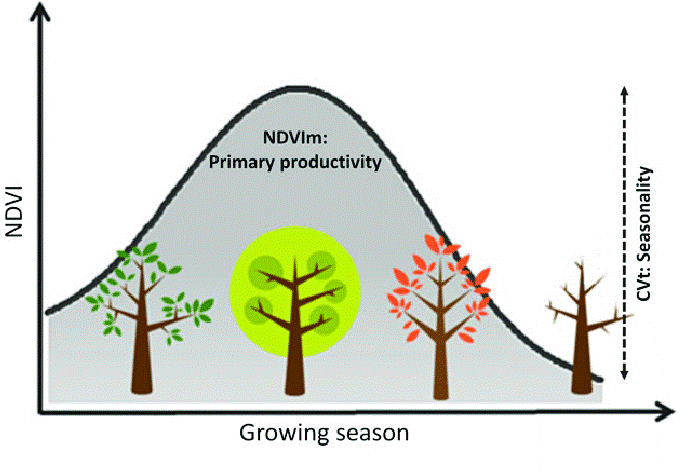
However, to count on reliable data, it is advisable to always take the different considerations into consideration phenological phases some plants. In fact, these influence the NDVI index which increases during the budding phase, stabilizes during the vegetative phase and reduces during senescence, according to a bell-shaped trend as schematized for a generic crop.
By combining health status and phenological stage of crops, different NDVI values can therefore be interpreted as follows:
NDVI Value Interpretation
<0 Inanimate objects or cloud outlines
0.4 Crop in serious distress or just planted/already harvested
0.5 Crop in distress or recently planted/senescent
0.55 Crop with problems or in the development/senescence phase
0.6 Crop with some problems or in the development/beginning of senescence phase
0.65 Crop not fully developed or with some growth problems
0.7 Developed and healthy crop
1 Fully developed and healthy crop
In conclusion, an NDVI that tends to reduce is a symptom of problems in the vegetative development of crops, which can be caused by water or nutritional stress, damage from adverse weather conditions (e.g. hail), parasitic attacks or other. NDVI is therefore a very useful tool for promptly identify any areas of crop distress, which are characterized by index values significantly lower than the other areas of the field.



Leave a reply